# 1.子图的介绍
前面讲述的图表绘制方法一次只会绘制一张图表,但是有些情况下,我们希望把一组图放在一起进行比较,有没有什么好的方法呢?matplotlib 中提供的 subplots() 可以很好的解决这个问题。通过调用 subplots() 可以将整个绘图区域分成 m * n 个子区域,每个子区域都可以绘制一个子图。
当 m = 1,n = 2 时,绘图区域的划分情况如下所示:


# 2.子图的绘制
下面我们通过例子来看 subplots() 函数的使用。
# 2.1 一个子图
import matplotlib.pyplot as plt
import numpy as np

x = np.linspace(0, 2*np.pi, 400)
y = np.sin(x)

fig, ax = plt.subplots()
ax.plot(x, y)
ax.set_title('plot sin')

plt.show()
2
3
4
5
6
7
8
9
10
11
在上面的代码中,调用 subplots() 函数时,没有传入参数,这样在默认情况下整个绘图区域只会包含一个子区域。subplots() 函数会返回两个值,一个是 fig,一个是 ax。接下来便可以使用 ax 对子图进行绘制。代码执行后得到的图形如下图所示:
# 2.2 多个子图
import matplotlib.pyplot as plt
import numpy as np

x = np.linspace(0, 2*np.pi, 400)
y1 = np.sin(x)
y2 = np.cos(x)

fig, ax = plt.subplots(nrows=2, ncols=1)

ax[0].plot(x, y1)
ax[0].set_title('plot sin')

ax[1].plot(x, y2)
ax[1].set_title('plot cos')

plt.show()
2
3
4
5
6
7
8
9
10
11
12
13
14
15
16
上面代码中,向 subplots() 函数传入参数 nrows 和 ncols,值分别为 2 和 1。这样整个绘图区域会被划分为两个子区域。返回值 ax 为包含两个子区域对象的数组,我们可以使用索引的方式来访问每个对象,下面便可以使用这两个对象进行绘图。代码执行后得到的图形如下图所示:

from os import sched_get_priority_max
import matplotlib.pyplot as plt
import numpy as np

x = np.linspace(0, 2*np.pi, 400)
y1 = np.sin(x)
y2 = np.cos(x)


fig, ax = plt.subplots(nrows=2, ncols=1, sharex=True)

ax[0].plot(x, y1)
ax[0].set_title('plot sin')

ax[1].plot(x, y2)
ax[1].set_title('plot cos')

plt.show()
2
3
4
5
6
7
8
9
10
11
12
13
14
15
16
17
18
为了让两个子图共享横坐标,只需要在调用 subplots() 函数时传入参数 sharex,并设置其值为 True。代码执行后得到的图形如下图所示:

from os import sched_get_priority_max
import matplotlib.pyplot as plt
import numpy as np

x = np.linspace(0, 2*np.pi, 400)
y1 = np.sin(x)
y2 = np.cos(x)


fig, ax = plt.subplots(nrows=1, ncols=2)

ax[0].plot(x, y1)
ax[0].set_title('plot sin')

ax[1].plot(x, y2)
ax[1].set_title('plot cos')

plt.show()
2
3
4
5
6
7
8
9
10
11
12
13
14
15
16
17
18
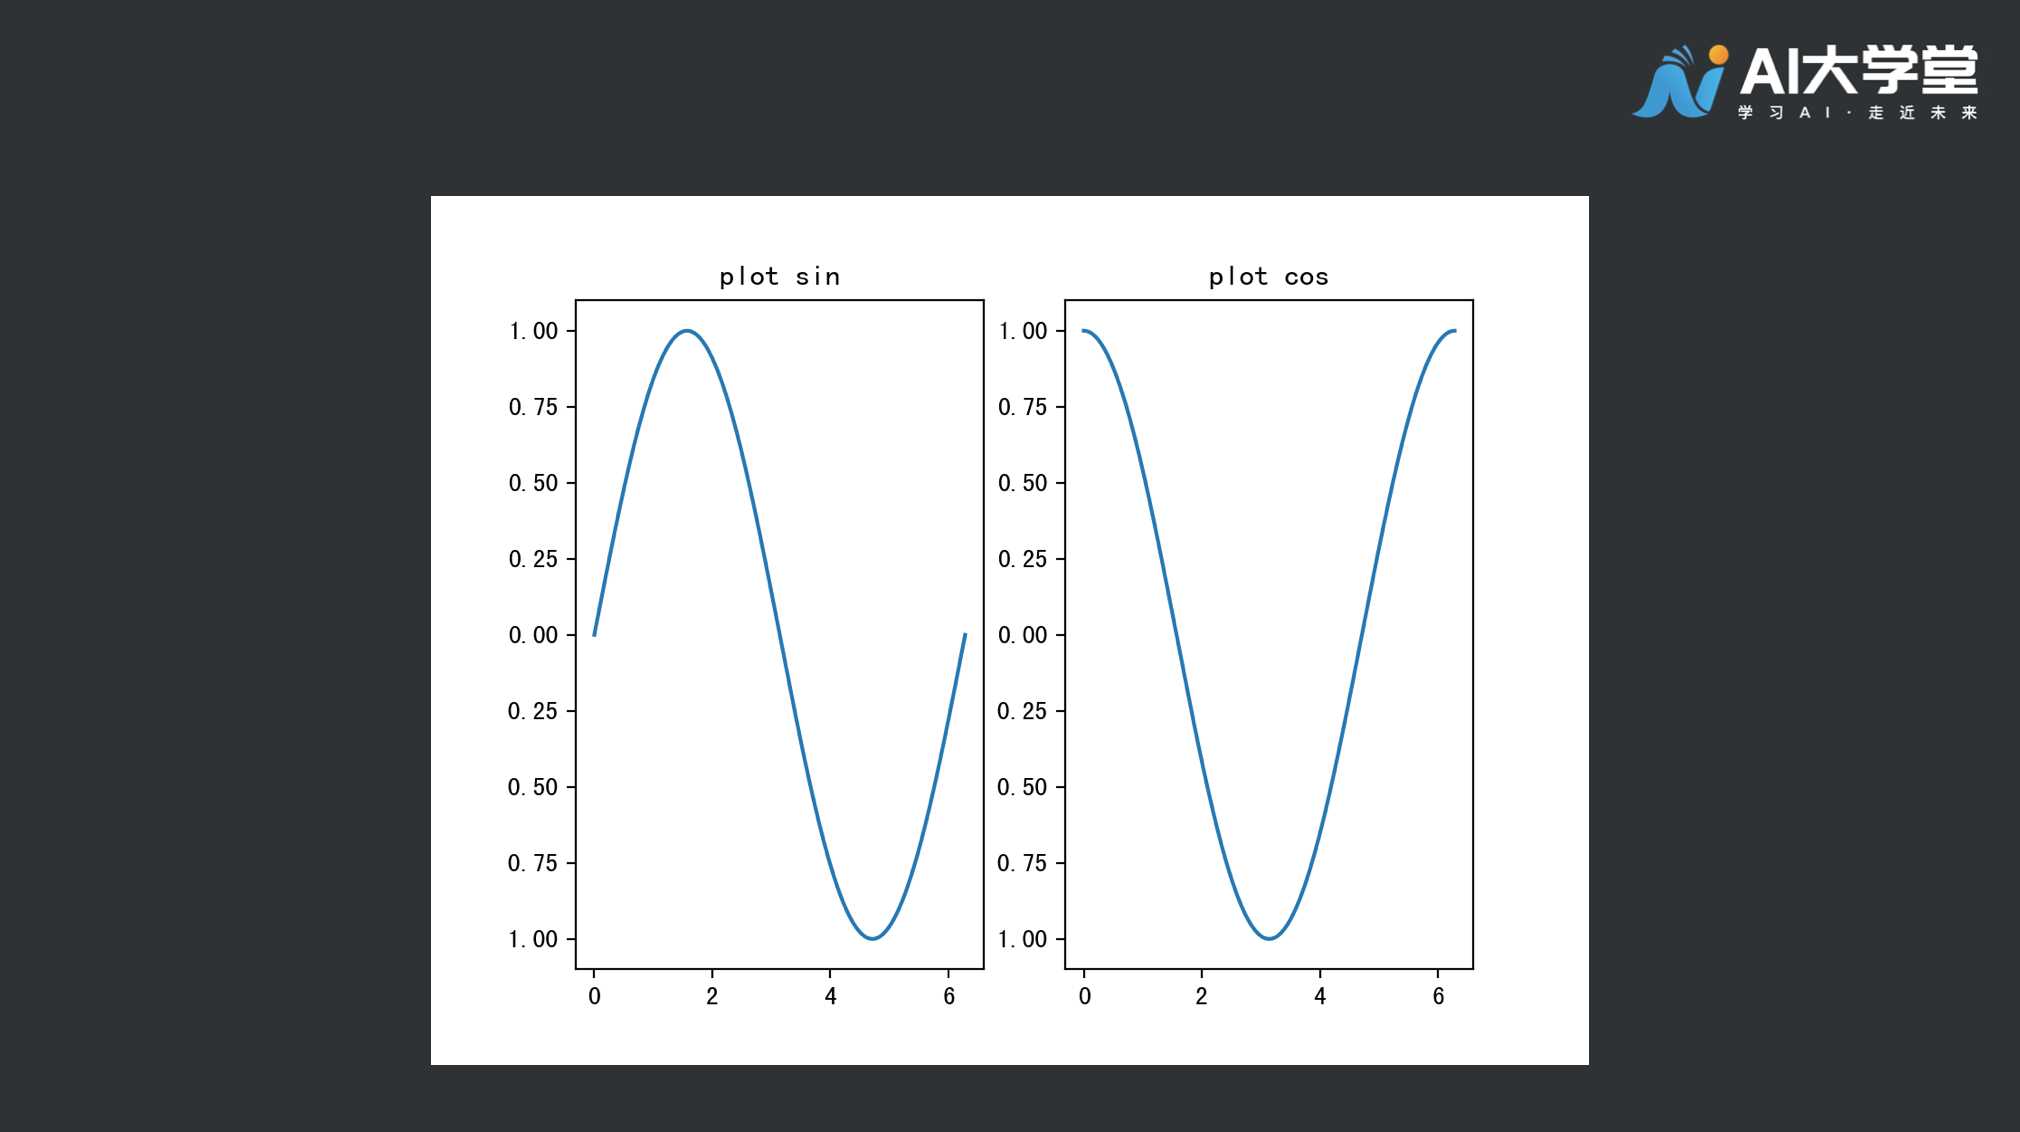
为了让两个子图左右排列,只需要将参数 nrows 和 ncols 的值分别设置为 1 和 2。代码执行后得到的图形如下图所示:

from os import sched_get_priority_max
import matplotlib.pyplot as plt
import numpy as np

x = np.linspace(0, 2*np.pi, 400)
y1 = np.sin(x)
y2 = np.cos(x)


fig, ax = plt.subplots(nrows=1, ncols=2, figsize=(18,5))

ax[0].plot(x, y1)
ax[0].set_title('plot sin')

ax[1].plot(x, y2)
ax[1].set_title('plot cos')

plt.show()
2
3
4
5
6
7
8
9
10
11
12
13
14
15
16
17
18
上面的代码中,在调用 subplots() 函数时,传入参数 figsize 来设置图形的长和宽。代码执行后得到的图形如下图所示:

from os import sched_get_priority_max
import matplotlib.pyplot as plt
import numpy as np

x = np.linspace(0, 2*np.pi, 400)
y1 = np.sin(x)
y2 = np.cos(x)


fig, ax = plt.subplots(nrows=1, ncols=2, figsize=(18,5), sharey=True)

ax[0].plot(x, y1)
ax[0].set_title('plot sin')

ax[1].plot(x, y2)
ax[1].set_title('plot cos')

plt.show()
2
3
4
5
6
7
8
9
10
11
12
13
14
15
16
17
18
为了让两个子图共享纵坐标轴,只需要向 subplots() 函数传入 sharey 参数,并设置其值为 True,代码执行后得到的图形如下图所示:

from os import sched_get_priority_max
import matplotlib.pyplot as plt
import numpy as np

x1 = np.linspace(0, 2*np.pi, 400)
y1 = np.sin(x1)
y2 = np.cos(x1)

x2 = np.linspace(0, 2*np.pi, 40)
y3 = np.sin(x2)
y4 = np.cos(x2)

fig, ax = plt.subplots(nrows=2, ncols=2)

ax[0,0].plot(x1, y1)
ax[0,0].set_title('plot sin')

ax[0,1].plot(x1, y2)
ax[0,1].set_title('plot cos')

ax[1,0].scatter(x2, y3)
ax[1,0].set_title('plot scatter sin')

ax[1,1].scatter(x2, y4)
ax[1,1].set_title('plot scatter cos')

plt.show()
2
3
4
5
6
7
8
9
10
11
12
13
14
15
16
17
18
19
20
21
22
23
24
25
26
27
在上面的代码中,ax 是一个 2 * 2 的数组,所以在进行索引的时候,需要使用二维数组的索引方法。代码执行后得到的图形如下图所示:

from os import sched_get_priority_max
import matplotlib.pyplot as plt
import numpy as np

x1 = np.linspace(0, 2*np.pi, 400)
y1 = np.sin(x1)
y2 = np.cos(x1)

x2 = np.linspace(0, 2*np.pi, 40)
y3 = np.sin(x2)
y4 = np.cos(x2)

fig, ax = plt.subplots(nrows=2, ncols=2, sharex=True, sharey=True)

ax[0,0].plot(x1, y1)
ax[0,0].set_title('plot sin')

ax[0,1].plot(x1, y2)
ax[0,1].set_title('plot cos')

ax[1,0].scatter(x2, y3)
ax[1,0].set_title('plot scatter sin')

ax[1,1].scatter(x2, y4)
ax[1,1].set_title('plot scatter cos')

plt.show()
2
3
4
5
6
7
8
9
10
11
12
13
14
15
16
17
18
19
20
21
22
23
24
25
26
27
代码执行后得到的图形如下图所示:
# 3.总结
本节课我们讲述了子图的绘制,它使得我们可以在同一个绘图区域绘制多个子图。


